Technowrites (talk | contribs) |
|||
| (13 intermediate revisions by 3 users not shown) | |||
| Line 1: | Line 1: | ||
| − | + | [[File:ScreenHunter_53 Sep. 25 14.29.jpg|left]] | |
| − | + | 1. Access the Sales module by clicking the '''Sales''' module tab. ''The Sales screen displays a listing of your sales opportunities. | |
| + | '' | ||
| + | 2. If desired, narrow your view of sales opportunities to particular type by clicking on the corresponding type in the Sales Module Home section: | ||
| + | * Select '''My Opportunities''' to view all your individual opportunities or only the '''Won''', '''Pending''' or '''Lost''' opportunities. | ||
| + | * Select '''All Opportunities''' to view all the organization's opportunities or only the '''Won''', '''Pending''' or '''Lost''' opportunities. | ||
| + | |||
| − | |||
| − | |||
| − | |||
| − | |||
| − | + | ||
| + | |||
| + | The '''Sales''' screen provides a graphic analysis of pending sales opportunities based upon the '''Stage''' and '''Estimated Close Date''' which you assigned to the opportunity. You may click any slice of the pie chart or any bar in the bar chart to view the details of that item. Additional analysis is available in the '''Analytics''' module. | ||
| + | |||
| + | |||
| + | [[File:ScreenHunter_52 Sep. 25 14.26.jpg]] | ||
| + | |||
| + | |||
| + | '''Note:''' The charts and graphs in the Sales module display information at the organization level only. The Analytics module provides additional options for presenting opportunity data. | ||
| + | |||
| + | |||
| + | Return to '''[[Sales Opportunities]]''' | ||
Latest revision as of 13:08, 2 December 2012
1. Access the Sales module by clicking the Sales module tab. The Sales screen displays a listing of your sales opportunities.
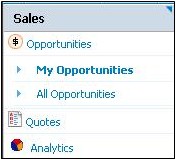
2. If desired, narrow your view of sales opportunities to particular type by clicking on the corresponding type in the Sales Module Home section:
- Select My Opportunities to view all your individual opportunities or only the Won, Pending or Lost opportunities.
- Select All Opportunities to view all the organization's opportunities or only the Won, Pending or Lost opportunities.
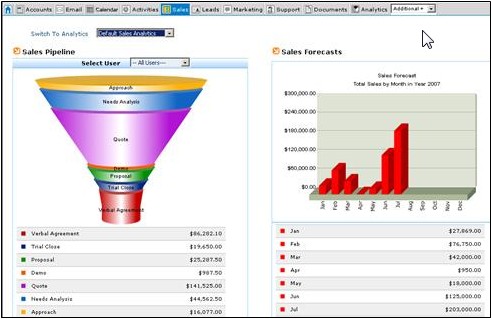
The Sales screen provides a graphic analysis of pending sales opportunities based upon the Stage and Estimated Close Date which you assigned to the opportunity. You may click any slice of the pie chart or any bar in the bar chart to view the details of that item. Additional analysis is available in the Analytics module.
Note: The charts and graphs in the Sales module display information at the organization level only. The Analytics module provides additional options for presenting opportunity data.
Return to Sales Opportunities

