Analytics
From Commence CRM-Help
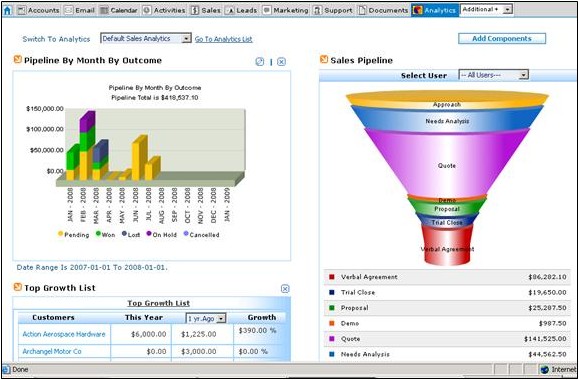
Various charts and other graphics may appear on your screen when the “Analytics” module is selected. These graphs present data based upon the information in your On-Demand database.
You may select which graphs appear by using the Add Component function.
1. To access the Analytics module click the Analytics tab. The Analytics screen displays.
2. Click Add Components button. The Add Component screen displays.
- To choose a chart/graph to the display, highlight title in the Available Component listing and click the Add button to move it to the Show these Components listing. Repeat for as many charts/graphs as desired.
- To remove a chart/graph from display, highlight the title in the Show these Components listing and click the Remove button to move it to the Available Components section. Repeat for as many charts/graphs as desired.
- To change the order in which charts/graphics appear, highlight a titles one at at time in the Show these Components area and use the Up and Down buttons to change the order of display.
3. Click the Save button to return to the Analytics screen. Your new selection of charts/graphs display.
Return to Analytics


