Difference between revisions of "Sales Opportunity/Graphic Analysis"
From Commence CRM-Help
| Line 2: | Line 2: | ||
:::::[[File:ScreenHunter_52 Sep. 25 14.26.jpg]] | :::::[[File:ScreenHunter_52 Sep. 25 14.26.jpg]] | ||
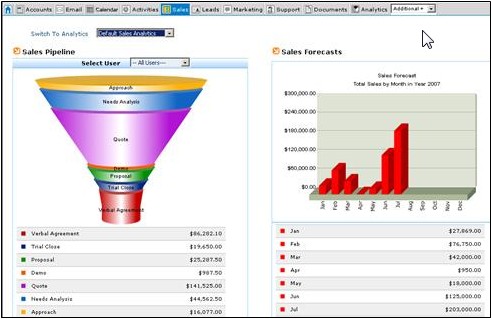
| − | The | + | The '''Sales''' screen provides a graphic analysis of pending sales opportunities based upon the '''Stage''' and '''Estimated Close Date''' which you have currently assigned to the opportunity. You may click any slice of the pie chart or any bar in the bar chart to view the details of that item. Additional analysis is available in the '''Analytics''' module. |
Revision as of 17:27, 20 November 2012
The Sales screen provides a graphic analysis of pending sales opportunities based upon the Stage and Estimated Close Date which you have currently assigned to the opportunity. You may click any slice of the pie chart or any bar in the bar chart to view the details of that item. Additional analysis is available in the Analytics module.

